From Reacting to Congestion to Forecasting It
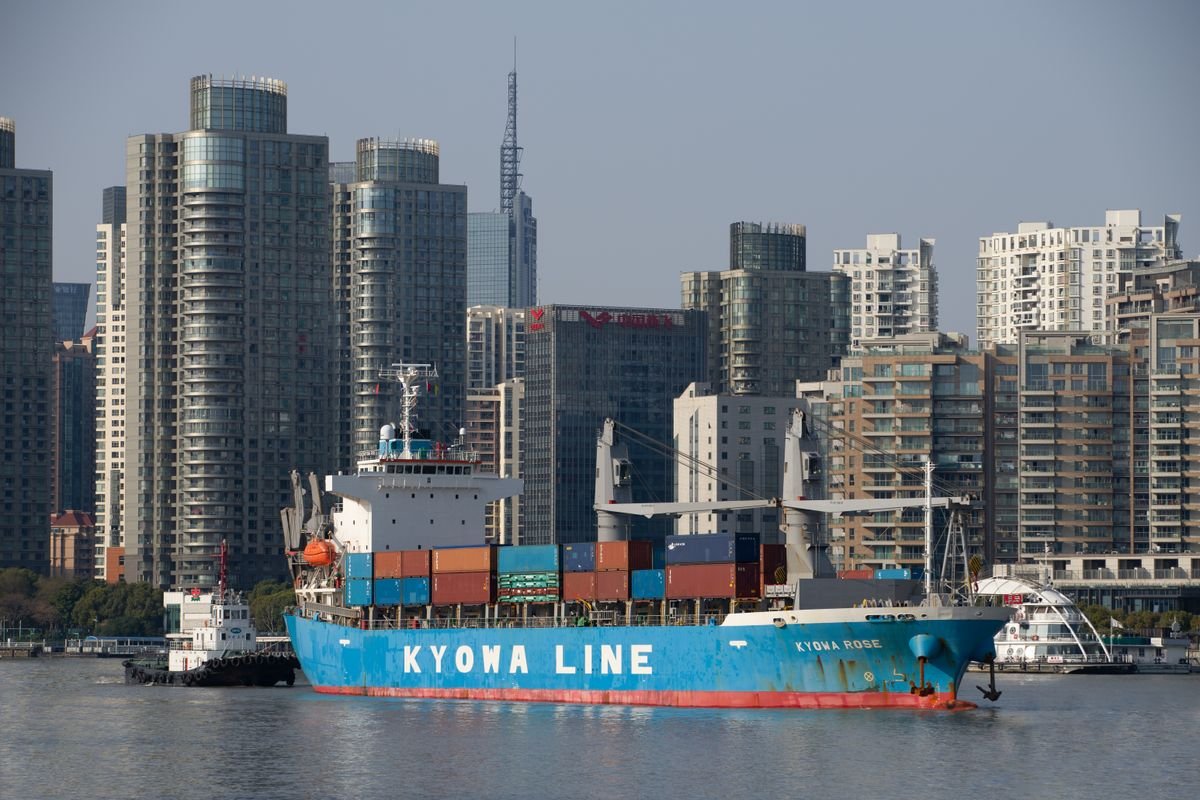
For most of container shipping's history, port congestion has been something shippers found out about after the fact — a vessel's ETA slipped, a booking confirmation came back with a longer-than-expected dwell window, or news coverage of a specific port backlog arrived once ships were already anchored offshore in visible numbers. Predictive port congestion analytics flips that sequence. By combining live vessel tracking data with berth schedules and historical patterns, these models now forecast how congested a specific port is likely to be on a specific future date, often with enough lead time for a shipper or forwarder to actually do something about it — rebook a sailing, adjust a routing, or simply reset a customer's delivery expectations before the delay becomes unavoidable. For transportation logistics planning teams managing multiple origin and destination ports simultaneously, that shift from reactive monitoring to forward-looking forecasting has become one of the more consequential applications of data analytics in ocean freight, turning congestion from a surprise absorbed after a booking is already committed into a known risk that can be priced, planned around, or avoided altogether.
The Data That Feeds a Congestion Forecast
These models draw on several layers of data simultaneously. The foundation is Automatic Identification System (AIS) data, the satellite and terrestrial vessel-tracking signal that commercial ships over a certain size are required to broadcast continuously under the International Maritime Organization's SOLAS Convention. AIS data shows exactly where every tracked vessel is, how fast it's moving, and — critically for congestion forecasting — how many ships are converging on a given port over the coming days. Layered on top of that are published berth allocation schedules and terminal operating plans, which show how much quay and crane capacity is actually available to handle that incoming vessel queue. Historical data on dwell times, yard utilization and past congestion events at the specific port being forecast adds the pattern-recognition layer, while external factors — weather forecasts affecting vessel speed, known customs or inspection bottlenecks, and calendar-driven demand spikes around events like Chinese New Year or Western retail peak season — round out the model's inputs.
How the Forecasting Models Actually Work
Most operational congestion-forecasting platforms use a form of machine learning trained on years of historical port performance data, learning the relationship between incoming vessel queue size, berth availability, seasonal demand patterns and the resulting congestion outcome — measured typically in added vessel waiting time or container dwell time. Once trained, the model takes today's live AIS-tracked vessel positions and current berth schedules as inputs and produces a congestion forecast for the port over the coming one to several weeks, often expressed as an expected waiting time range or a simple risk score. Because the underlying AIS and berth-schedule data refreshes continuously, these forecasts update as conditions change — a model might show a port trending toward a congestion spike ten days out, then revise that forecast downward if several vessels adjust their routing or a berth comes back online faster than expected.
What the Models Learn From Past Congestion Cycles
The value of historical training data became obvious during the congestion cycles of the early 2020s, when pandemic-driven demand surges, intermittent terminal closures and chassis and labor shortages combined to produce vessel queues at ports such as Los Angeles, Long Beach and Yantian that stretched into weeks rather than days. Those events generated an unusually rich dataset connecting specific combinations of incoming vessel volume, yard utilization and labor availability to the resulting delay — exactly the kind of pattern a predictive model can learn from and later recognize earlier in a new build-up, even one driven by a different root cause. Ports have also absorbed their own lessons from that period, investing in better yard automation and data-sharing with carriers, which has in turn improved the quality and timeliness of the inputs these congestion-forecasting models now have available. The result is a feedback loop: better port data produces better forecasts, and better forecasts help ports and shippers alike respond to a building backlog before it reaches the scale seen in those earlier disruptions.
How This Differs from Related Forecasting Tools
It's worth being precise about where this fits relative to other technology already covered on our site. Our piece on predictive ETA forecasting looks at AI models that estimate when a specific shipment will arrive at its final door-to-door destination — a narrower, shipment-level question. Predictive port congestion analytics instead forecasts conditions at the port level, independent of any single shipment, which can then feed into a more accurate shipment-level ETA or inform a routing decision before a booking is even made. And where our update on port congestion at Shanghai and other major hubs covers a specific, real-world congestion event and its causes, this piece is about the underlying forecasting technology and methodology that applies across any port, not one particular incident. The two are complementary: forecasting technology is what gives early warning of the next version of an event like the one covered in that update, rather than reporting on it after it has already happened.
Reactive Monitoring vs. Predictive Forecasting
| Approach | Typical Lead Time | Data Used | Shipper Response Window |
|---|---|---|---|
| Static sailing schedule | None (fixed at booking) | Published carrier timetable only | None — delay discovered after the fact |
| Reactive monitoring | Hours to a few days | Current vessel status and port reports | Limited — congestion already underway |
| Predictive congestion analytics | Days to several weeks | AIS, berth schedules, historical patterns, seasonality | Meaningful — time to reroute or rebook |
What Shippers and Forwarders Actually Do With a Forecast
- Rerouting to an alternate port — when a forecast shows a specific port trending toward a multi-day backlog, cargo can sometimes be redirected to a nearby port with better availability before the vessel sails, rather than after arrival.
- Adjusting booking timing — shippers with flexibility on sailing dates can shift a booking earlier or later to avoid a forecast congestion peak, particularly around predictable seasonal surges.
- Resetting customer delivery expectations early — a reliable forecast lets a forwarder communicate a realistic delivery window to the end customer well before the shipment actually experiences the delay.
- Adjusting inland transportation bookings — trucking and rail capacity booked to collect cargo from a port can be rescheduled in line with a revised forecast, avoiding wasted driver and equipment time waiting at a terminal.
Who Builds and Uses These Forecasts
Congestion forecasting has moved from an internal carrier tool to a broader market offering over the past several years. Supply chain visibility platforms now sell congestion risk scores and forecasts as a standard feature alongside shipment tracking, often blending their own AIS and berth-schedule analysis with data licensed from maritime intelligence providers that specialize in vessel tracking at scale. Large shippers with enough volume to justify the investment have in some cases built internal forecasting capability of their own, feeding it directly into their transportation management systems so a congestion risk score appears automatically next to a proposed booking. For small and mid-sized shippers without that scale, the more common path is to rely on a freight forwarder or logistics provider that has access to this kind of forecasting as part of its own operational toolkit, which is generally more cost-effective than licensing a standalone platform for occasional use.
Where These Models Still Fall Short
Predictive congestion analytics is pattern-based, and it's important to be honest about what that means in practice. These models are well suited to forecasting congestion driven by predictable, recurring factors — seasonal demand spikes, known berth maintenance schedules, weather patterns with historical precedent. They are much less capable of anticipating a sudden, unprecedented disruption: a dockworker strike called with little notice, a geopolitical event closing a shipping lane, or a safety incident shutting down a terminal unexpectedly. Our companion piece on digital twins for port and terminal operations looks at a related but distinct technology that simulates terminal operations in detail to optimize day-to-day berth and yard decisions — useful alongside congestion forecasting, but aimed at a different problem. The practical lesson for transportation logistics teams is to treat a congestion forecast as a strong input for planning around predictable patterns, not a substitute for the contingency planning still needed for genuinely novel disruptions — the two work best used together, with the forecast handling the routine seasonal and operational buildups and a separate contingency plan covering the lower-probability, higher-impact events a pattern-based model simply cannot see coming.
How RR Brothers and Logistics Can Help
Working across sea freight, multimodal transport and customs clearance in ports throughout China and our wider network, RR Brothers and Logistics tracks vessel schedules and port conditions as a routine part of planning every booking, not an afterthought. When a client's cargo is moving through a port showing early signs of a congestion buildup, our team can advise on realistic transit expectations, evaluate whether an alternate routing or port makes sense, and keep inland trucking and documentation plans aligned with the vessel's actual, rather than originally scheduled, arrival, so a forecast turns into a practical adjustment rather than just an early warning.
Frequently Asked Questions
These models typically combine live vessel position data from AIS transponders, published berth and terminal schedules, historical dwell-time and vessel-queue records for the specific port, and contextual factors such as weather forecasts, customs processing patterns and known seasonal demand peaks.
Useful forecasts typically extend from several days up to a few weeks ahead, since the models rely on vessels that are already visible in AIS tracking data approaching the region, combined with known berth schedules and seasonal patterns. They are far less able to predict sudden, non-pattern-based disruptions with that same lead time.
Predictive ETA forecasting estimates when a specific shipment will arrive at its final destination door to door. Predictive port congestion analytics instead forecasts conditions at a specific port itself — how backed up it's likely to be on a given date — which can then feed into a more accurate ETA estimate or a decision to route around that port entirely.
No — these models are pattern-based and work from historical and currently observable data, so they are well suited to forecasting congestion driven by predictable factors like seasonal demand or berth scheduling, but they cannot anticipate a sudden strike, conflict or regulatory shock that has no comparable precedent in the training data.